show the code
library(hexSticker)
library(magick)
library(sysfonts)
library(qrcode)library(hexSticker)
library(magick)
library(sysfonts)
library(qrcode)My peers, Atahualpa Ayala, Dalila Lara, Guillermo Romero and I came up with the name PYFOREST as a team name for our capstone project: Informing Forest Conservation Regulations in Paraguay. ‘PY’ stands for Paraguay and that we would be using some Python in our analysis. ‘Forest’ underscores our focus on researching and conserving the Paraguayan Chaco, a diverse forest ecosystem.
An interesting project deserves an equally captivating logo. With this in mind, I took the lead in designing a logo that would encapsulate the essence of PYFOREST. Leveraging tools like I used Adobe Express and Canva to help come up with ideas for the logo. I obtained the free tree image on Adobe Express and saved it as a PNG. I then used image_read from the magick package to read the PNG from a file path. I then followed the hexSticker documentation to create the hexagon sticker. You can also type ??sticker in the console to view all of the arguments in R.
# Read in tree image
img <- image_read("/Users/alexreed/Documents/MEDS/Capstone/R/tree.png")

# Sticker function
sticker(subplot = img,
        package="PYFOREST",
        p_size=40,
        p_y = 0.55,
        p_color = "#FAF8F2",
        p_family = "Aller_Rg",
        s_x= 1,
        s_y= 1.2,
        s_width= 1.7,
        s_height = 20,
        filename="posts/2023-08-18-hex/pyforest_hex_sticker.png",
        h_size = 0.5,
        h_fill="#4B5F44",
        h_color = "#354032",
        url = "https://github.com/cp-PYFOREST",
        u_size = 6,
        u_color = "#FAF8F2",
        u_x = 1,
        u_y = 0.065,
        dpi = 600) |>
  print()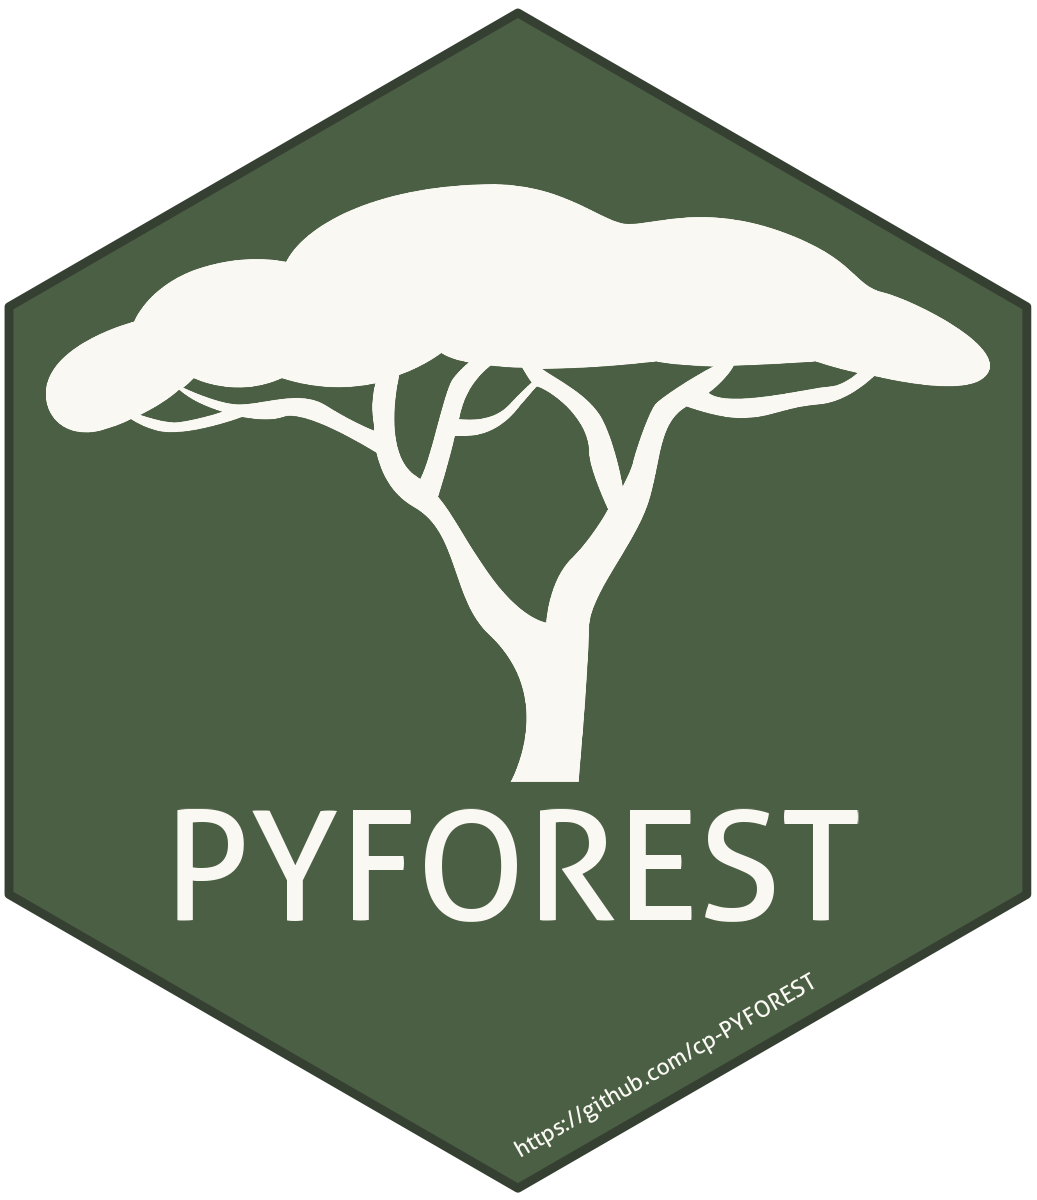
In a collaborative effort, our team recognized the importance of maintaining visual coherence throughout our data visualizations. Since each team member was responsible for creating their own visualizations, we decided to establish a shared color palette. We used coolors.com to help us create our color palette.
library(ggplot2)

# Define the color palette
pyforest_palette <- c("#2f4858", "#a7c7d8", "#4B5F43", "#AEBD93", "#F6AE2D", "#F26419")
#Charcoal, Columbia Blue, Hunter Green, Sage, Hunyadi Yellow, Orange (Pantone)
palette_names <- c("Charcoal", "Columbia Blue", "Hunter Green", "Sage", "Hunyadi Yellow", "Orange (Pantone)")

# Create a data frame to store color names and values
palette_data <- data.frame(Color = factor(palette_names, levels = rev(palette_names)), Value = pyforest_palette)

# Create a ggplot bar plot displaying the colors
ggplot(palette_data, aes(x = Color, y = 1, fill = Value)) +
  geom_bar(stat = "identity") +
  scale_fill_identity() +
  theme_minimal() +
  labs(x = NULL, y = NULL, title = "PYFOREST Palette") +
  coord_flip() +
  theme(
    plot.title = element_text(hjust = 0.5,
                              size = 16),
    axis.ticks = element_blank(),
    panel.grid.major.y = element_blank(),
    panel.grid.minor.y = element_blank(),
    panel.grid.major.x = element_blank(),
    panel.grid.minor.x = element_blank(),
    axis.text.y = element_text(size = 12),
    axis.text.x = element_blank(),
    panel.border = element_blank(),  # Remove panel border
    plot.background = element_rect(fill = '#FBFEF9', color = NA))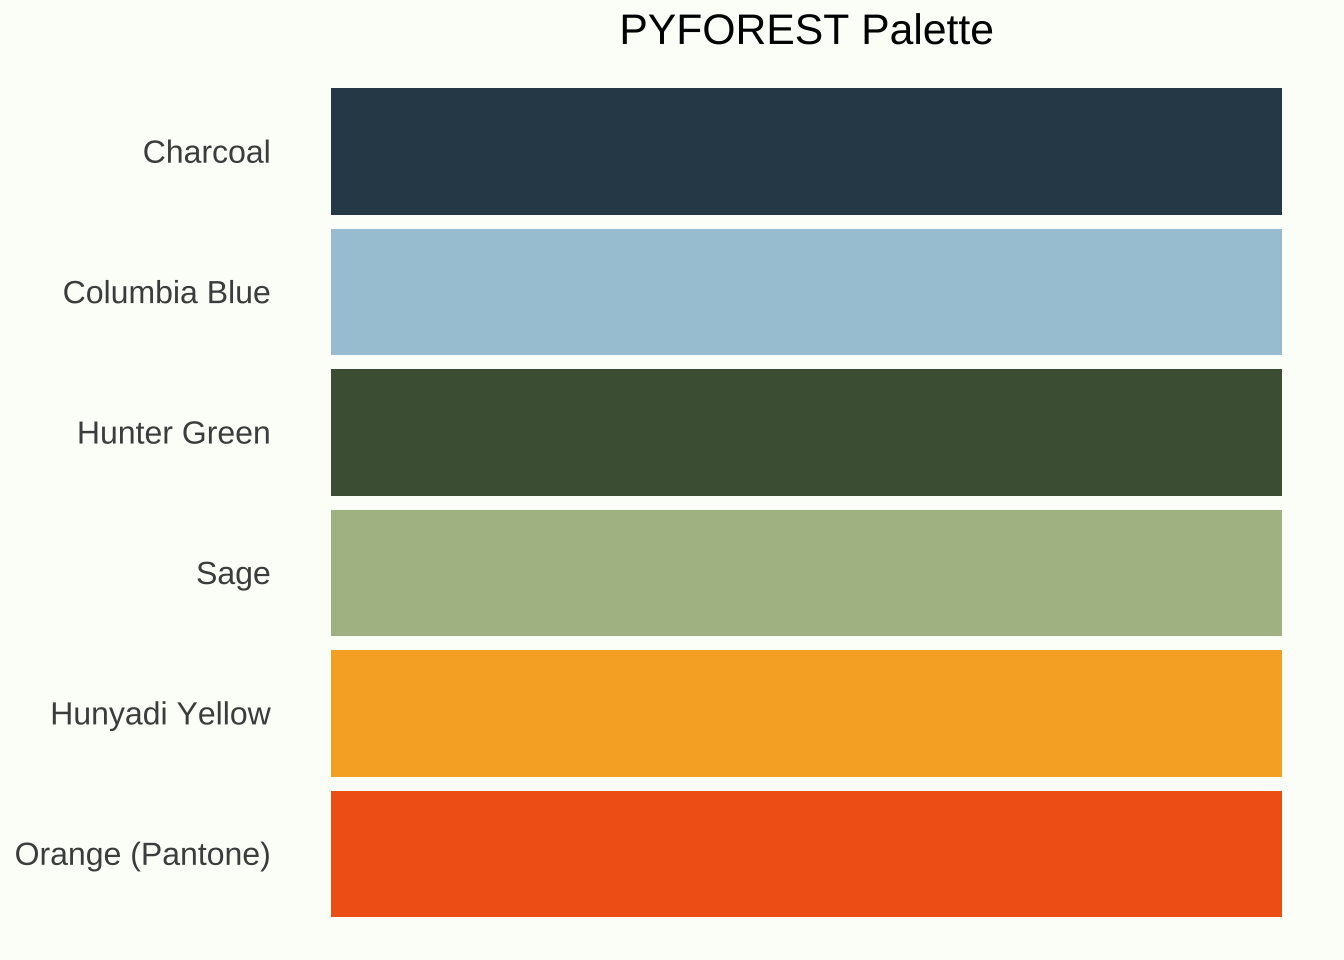
To enhance our project’s accessibility, we created a QR code. By simply passing the relevant URL through the qr_code() function, we generated a QR code that provided easy access to our project’s GitHub repository. We embedded the QR code on the final slide of our presentation, allowing audience members to quickly delve deeper into our research.
url <- "https://github.com/cp-PYFOREST"
qr <- qr_code(url)
plot(qr)# Save the qr code as a svg
generate_svg(qr, "filepath/qr.svg")
@online{reed2023,
  author = {Alex Reed},
  title = {Elevating {Your} {Project:} {Branding} Using {R}},
  date = {2023-08-18},
  url = {https://reedalexandria.github.io/2023-08-18-hex},
  langid = {en}
}